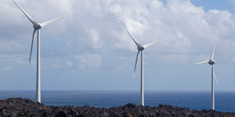
Megatrends affecting Latin America and the Caribbean
- ↑ Technological advances, ∆ + MW per resource
- ↑ Access to NCRE, ∆ reg. framework, developer invest via: (i) auctions & (ii) auto supply.
- ↑ LT funding, historically low borrowing, investment grade countries, local cap markets,
- ↓ Price of NCRE, slowdown in China (equipment cheaper & dev. tech), Europe crisis
- ↑ Demand (MW) ≈ maintain prices ↑
- Latin America and the Caribbean (LAC) shifted to Non-Conventional Renewable Energy (NCRE) (i.e., Wind & others)
- Mexico has best wind resources in the world, superior Europe and US
- The shift from hydro to NCRE (i.e., wind & others) ≈ environmental and social.
- Focus on competitive on-grid parity without Feed-In-Tariffs (FIT)
Wind Technological Advances
↑ MW p/resource via:
- Direct drive turbines
- ↑ MW per resource (12-MW prototype)
- Enhancement of pitch blade
- Shallow off-shore wind = prices ↓
Access to Developers
Auto-suppliers, Brazil, Mexico
Long-Term Financing
Funding critical to NCRE - Brazil’s BNDES, ≈ TJLP + 4% spread ≈ US¢5.5/KWh
Local bond issuance
Export Credit Agency (ECA) ≈ 70% equipment
≈ 50% project cost ≈ turbine w/ECA financing
Price
Wind turbine cost from US$2 million p/MW → US$1.2 million p/MW (2013)
Electricity Demand
↑ middle class in LAC ≈ 2x electricity demand (Mexico ↑ pop. 1 million ≈ 1-GW/yr.)
↑ demand will maintain prices ≈ ↑, due to: (i) inefficiencies of the LAC energy markets (public sector monopolies); (ii) Long-term legacy of inefficient generation
Wind Energy vs. Natural Gas Generation
Opportunities
Energy is a regulated commodity ≈ varies from country to country (countries ≠ equal)
NCRE resources ∆ each country & within a country (similar to oil & gas reserves)
NCRE exploitation lies in the route of access & pricing
Advantages of Wind
- Free fuel & limited operational expense;
- Off-takers pay fixed rate / cap for life of project
- No cost uncertainty
- once debt amortized energy undercuts all fossil-fuel sources
Renewable Energy Highly dependent on the Capital Structure
Cost of Capital
| Cost of Capital Investment |
O&M & Fuel Cost |
Equity/Debt |
ROE & PPA Price |
| Wind 81% |
19% |
Influence More |
→ ROE & PPA |
| Natural Gas 26% |
74% |
Influence Less |
→ ROE & PPA |
Typical Debt/Equity 70/30
No country has the combination of enabling factors as the US: experience in conventional Oil & Gas, existing infrastructure, clarity of land ownership, and ownership of the resources on / under the land.

